Seminars / Lectures
IITM Publication Highlights
Impact of monsoon on below cloud base aerosol hygroscopicity over a rain shadow region of India
 Vertically constrained observations of aerosol size distribution and hygroscopicity using the Cloud Aerosol Interaction and Precipitation Enhancement Experiment (CAIPEEX) measurements during the monsoon seasons of 2018 and 2019 over a typical global climate model grid area are presented. Two regimes of aerosol loading - low and high, were identified within the season. The observations are first-of-its-kind from the Indian region, covering two contrasting monsoon seasons, and are useful for studying aerosol-cloud interactions and constraining models. This study highlights the need and importance of such extensive field campaigns in obtaining critical information that can be used to constrain weather and climate models.
Varghese M., Malap N., Konwar M., Bera S., Jose J., Bankar S.P., Murugavel P., Prabhakaran Thara, Atmospheric Research, 285: 106630, April 2023, DOI:10.1016/j.atmosres.2023.106630, 1-13
Read MoreAnthropogenically-forced weakening of the Indian summer monsoon and enhancement of the western North Pacific tropical cyclogenesis
 The study examines how climate change affects the way convective activities interact between the Indian summer monsoon (ISM) and the western North Pacific (WNP). Anthropogenically-forced weakening of the ISM circulation tends to significantly enhance the genesis potential index (GPI) of the WNP tropical cyclones by 13.5% and associated convective activities by reorienting the large-scale flow over the tropical Indo-Pacific in a manner that is conducive for enhancement of the WNP tropical cyclogenesis.
Using causal network analysis, the study found that in the anthropogenic simulation, there are shorter time-lags (~4-9 days) between the Indian summer monsoon, GPI, and tropical Indo-Pacific wind (IPWND), while in the natural simulation, the time-lags are longer (~19-28 days). This gives a clear hint that any change in convective activity over the Indian region could potentially influence cyclone activity in the WNP, and that has an anthropogenic signature.
Sagar A., Krishnan R., Sabin T.P., Frontiers in Earth Science, 11: 1149344, March 2023, DOI:10.3389/feart.2023.1149344, 1-18
Read MoreSoil moisture revamps the temperature extremes in a warming climate over India
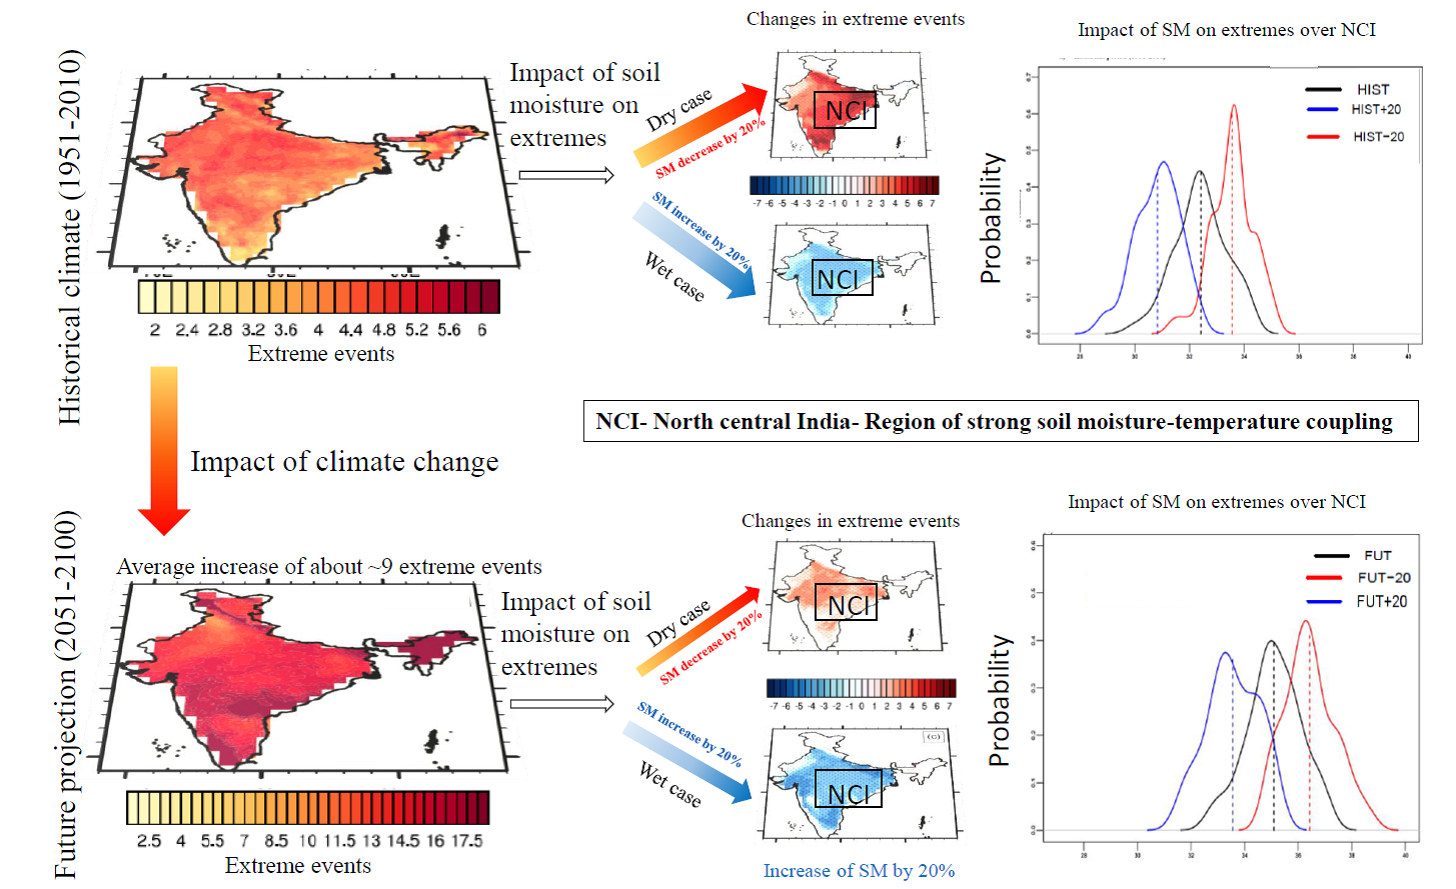 The study investigated the impact of soil moisture (SM) perturbations on temperature extremes over India for the historical period (1951–2010) and future climate projection (2051–2100) under 4 K warming scenario by using the Meteorological Research Institute (MRI) high-resolution (~60 km) atmospheric general circulation model (i.e. MRI-AGCM3.2). This study suggest that a 20% increase of SM perturbation applied on the HIST and FUT experiments, tends to decrease the frequency and duration of ExT events over NCI by nearly 60–70% and 20–30%, respectively. Conversely, a 20% decrease of SM perturbation applied on the HIST and FUT experiments, tends to increase the frequency and duration of ExT events over NCI by nearly 60–100% and 15–40%, respectively.
Ganeshi N.G., Mujumdar M., Takaya Y., Goswami M.M., Singh B.B., Krishnan R., Terao T., npj Climate and Atmospheric Science, 6: 12, February 2023, DOI:10.1038/s41612-023-00334-1, 1-13
Read MoreOn the transition of major pollutant and O3 production regime during Covid-19 lockdowns
 Lockdowns enforced amid the pandemic facilitated the evaluation of the impact of emission reductions on air quality and the production regime of O3 under NOx reduction. Analysis of space-time variation of various pollutants (PM10, PM2.5, NOx, CO, O3 and VOC or TNMHC) through the lockdown phases at eight typical stations (Urban/Metro, Rural/high vegetation and coastal) is carried out. It reveals how the major pollutant (PM10 or PM2.5 or O3, or CO) differs from station to station as lockdowns progress depending on geography, land-use pattern and efficacy of lockdown implementation. Among the stations analyzed, Delhi (Chandnichowk), the most polluted in pre-lockdown, experienced maximum reduction during the first phase of lockdown in PM2.5, CO while O3 remained almost the same (2% reduction) to pre-lockdown levels. The least polluted Mahabaleshwar witnessed relatively less reduction in PM2.5, NO2, CO while O3 increased by 36% to pre-lockdown levels. In rural stations with lots of greenery, O3 is the major pollutant attributed to biogenic VOC emissions from vegetation besides lower NO levels. In other stations, PM2.5 or PM10 is the primary pollutant.
Latha R., Bano Shahana, More Dolly, Ambulkar R., Mondal T., Maurya P., Murthy B.S., Journal of Environmental Management, 328: 116907, February 2023, DOI:10.1016/j.jenvman.2022.116907, 1-10
Read MoreNew Publications
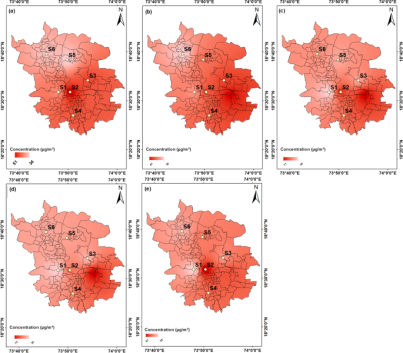
Five-Year Fine Particulate Matter Assessment over a Western Indian Megacity
Anand V., Korhale N., Panicker A.S., Beig G., Murthy B.S., Pure and Applied Geophysics, 180, March 2023, DOI:10.1007/s00024-023-03235-9, 1099–1111
On the modern deep learning approaches for precipitation downscaling
Kumar Bipin, Atey K., Singh B.B., Chattopadhyay R., Acharya N., Singh Manmeet, Nanjundiah R.S., Rao Suryachandra A., Earth Science Informatics, Online, March 2023, DOI:10.1007/s12145-023-00970-4, 1-14
What drives the decadal variability in sea surface salinity and stratification over the tropical Indian Ocean?
Mohapatra S., Gnanaseelan C., Fousiya T.S., Dandapat S., Theoretical and Applied Climatology, Online, March 2023, DOI:10.1007/s00704-023-04429-w, 1-17
Regional variability of precipitation characteristics in Tropical Cyclones over the North Indian Ocean from GPM-DPR measurements
SunilKumar K., Das Subrata K., Deshpande S.M., Deshpande Medha, Pandithura G., Atmospheric Research, 283: 106568, March 2023, DOI:10.1016/j.atmosres.2022.106568, 1-15
PDF Publisher LinkIITM Events

National Science Day
(28 February 2023)
IITM celebrated the National Science Day on 28th February 2023 by observing an open day at its premises. IITM also participated in the two days Science Exhibition at the Giant Metrewave Radio Telescope (GMRT) observatory at Khodad, Narayangaon from 28 February 2023 - 1 March 2023.


